Overview
perf is a linux profiling tool. I read this blog post about perf coming to python 3.12 and I wanted to recreate it and experiment.
This post highlights some perf goodness. It also provides the docker image I used on my m1 mac to play with perf. All the code is available here.
Goodness
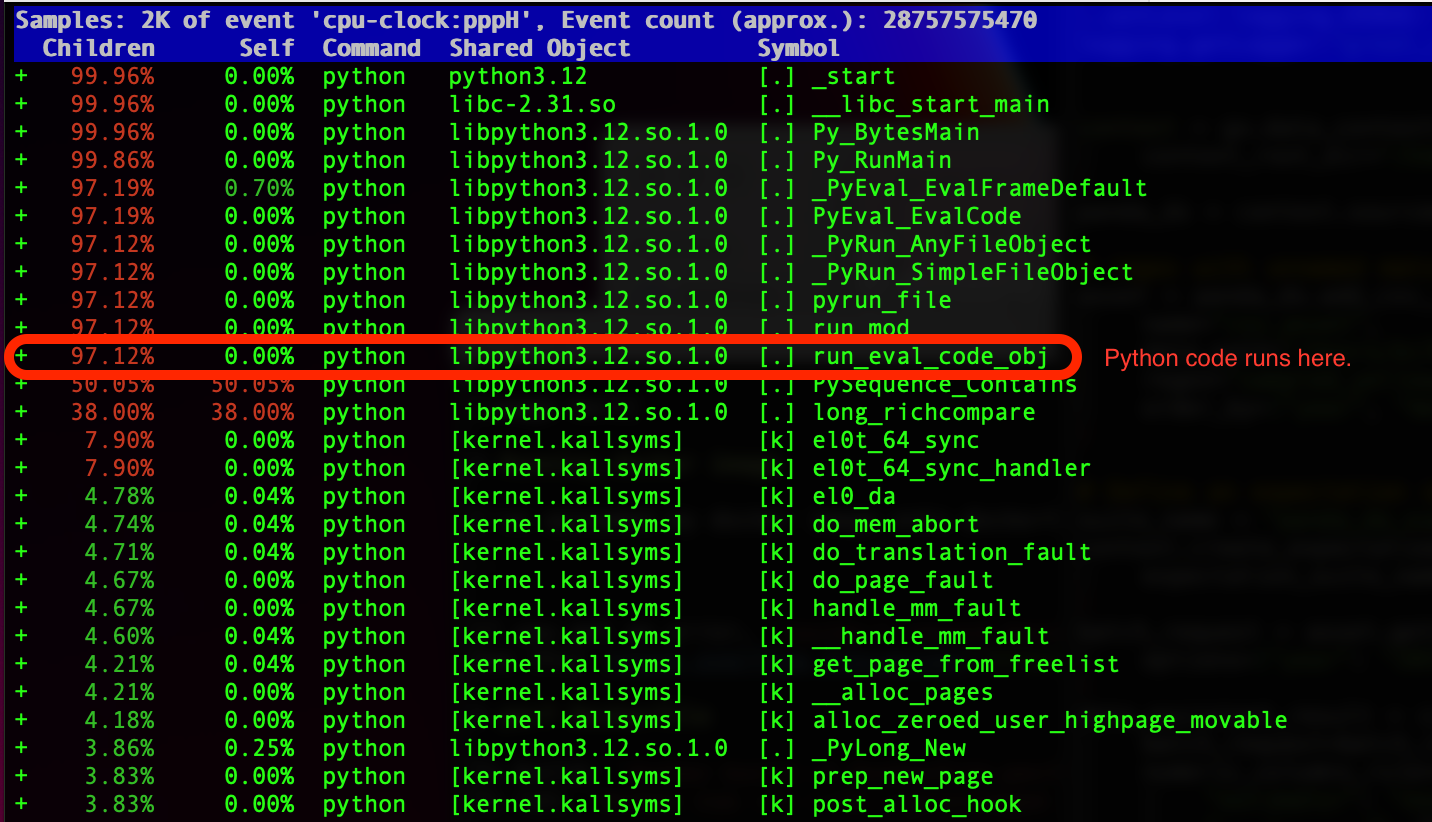
Before python 3.12 if we used perf to profile our code we wouldn’t see our python function names:
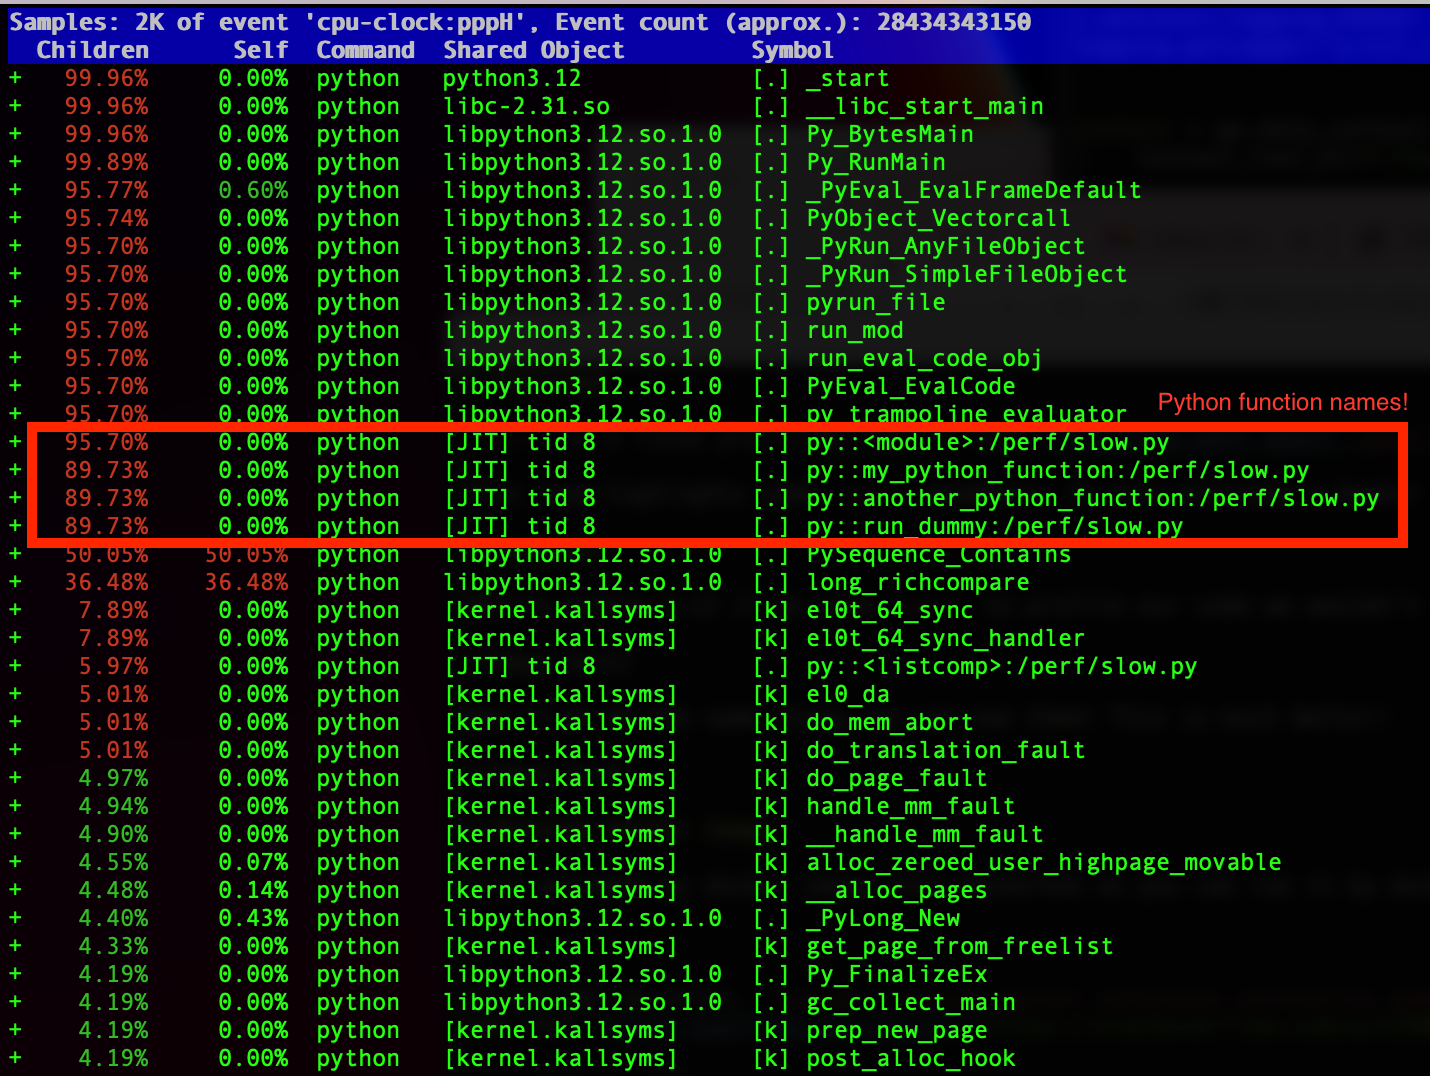
Now if we do the same thing, we can see them. This is much better!
Running docker image
I’ve uploaded my docker image onto dockerhub so you can run it by doing:
docker run -it --rm --privileged --mount type=bind,source=${PWD},target=/perf/to_local bdirks/pyperf:latest bash
If you get an error, Couldn't record kernel reference relocation symbol, you may need to run sysctl -w kernel.kptr_restrict=1 in the docker container.
See this stack overflow discussion.
perf Dockerfile
If you want to manually build the docker image do the following:
To build:
docker build -f Dockerfile.perf --tag pyperf:latest .
To run:
docker run -it --rm --privileged --mount type=bind,source=${PWD},target=/perf/to_local pyperf:latest bash
perf Commands
Running python with perf support.
# Run perf on a slow python file (~30 s)
perf record -F 99 -g -- python slow.py

# See profiling report
perf report -g -i perf.data

# Create flamegraph svg on local directory
perf script > out.perf
/FlameGraph/stackcollapse-perf.pl out.perf > out.folded
/FlameGraph/flamegraph.pl out.folded > to_local/flame.svg
To see the profiling report without python symbols, restart the docker image, turn off python perf support, unset PYTHONPERFSUPPORT, and rerun the commands above.
Using this image to run perf on your own python files
We’ll call the directory you ran the docker run command the “mounted host directory”. This directory is accessbile in your docker container at /perf/to_local. If you want to run perf against one of your own python files, you can put it in mounted host directory and then run perf from the /perf/to_local. For example:
cd /perf/to_local/
perf record -F 99 -g -- python <your_python_file.py>
perf script > out.perf
/FlameGraph/stackcollapse-perf.pl out.perf > out.folded
/FlameGraph/flamegraph.pl out.folded > flame.svg
The generated perf.data, out.perf, out.folded, flame.svg are accessible in the docker container at /perf/to_local and outside the docker container in the mounted host directroy.